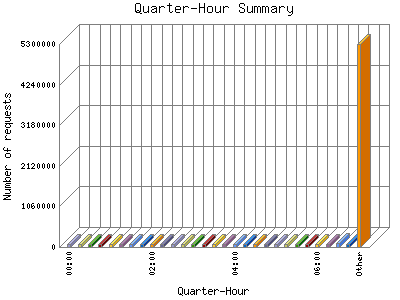
The Quarter-Hour Summary shows an overview of site activity over the course of a day, broken down into fifteen-minute intervals. If your report has enough traffic this will give you a detailed graph of your site's load throughout the day.
| Quarter-Hour | Number of requests | Percentage of the requests | |
|---|---|---|---|
| 1. | 00:00 | 111,784 | 1.9% |
| 2. | 00:15 | 106,335 | 1.2% |
| 3. | 00:30 | 109,289 | 1.6% |
| 4. | 00:45 | 109,712 | 1.7% |
| 5. | 01:00 | 106,441 | 1.2% |
| 6. | 01:15 | 109,378 | 1.6% |
| 7. | 01:30 | 107,549 | 1.4% |
| 8. | 01:45 | 111,336 | 1.8% |
| 9. | 02:00 | 107,664 | 1.4% |
| 10. | 02:15 | 106,854 | 1.3% |
| 11. | 02:30 | 108,185 | 1.4% |
| 12. | 02:45 | 104,577 | 1.1% |
| 13. | 03:00 | 103,930 | 1% |
| 14. | 03:15 | 103,495 | 1% |
| 15. | 03:30 | 104,145 | 1% |
| 16. | 03:45 | 102,647 | 0.100% |
| 17. | 04:00 | 101,382 | 0.99% |
| 18. | 04:15 | 102,743 | 0.100% |
| 19. | 04:30 | 109,760 | 1.7% |
| 20. | 04:45 | 100,882 | 0.98% |
| 21. | 05:00 | 100,655 | 0.98% |
| 22. | 05:15 | 100,843 | 0.98% |
| 23. | 05:30 | 102,452 | 0.100% |
| 24. | 05:45 | 101,527 | 0.99% |
| 25. | 06:00 | 99,405 | 0.97% |
| 26. | 06:15 | 97,382 | 0.94% |
| 27. | 06:30 | 122,734 | 1.19% |
| 28. | 06:45 | 110,872 | 1.8% |
| 29. | 07:00 | 97,986 | 0.94% |
| 30. | 07:15 | 103,196 | 0.100% |
| 31. | 07:30 | 110,160 | 1.7% |
| 32. | 07:45 | 99,039 | 0.96% |
| 33. | 08:00 | 99,919 | 0.97% |
| 34. | 08:15 | 99,600 | 0.97% |
| 35. | 08:30 | 104,751 | 1.1% |
| 36. | 08:45 | 100,252 | 0.97% |
| 37. | 09:00 | 114,372 | 1.10% |
| 38. | 09:15 | 100,033 | 0.97% |
| 39. | 09:30 | 102,851 | 0.100% |
| 40. | 09:45 | 106,339 | 1.2% |
| 41. | 10:00 | 98,534 | 0.96% |
| 42. | 10:15 | 109,665 | 1.7% |
| 43. | 10:30 | 99,184 | 0.96% |
| 44. | 10:45 | 99,516 | 0.97% |
| 45. | 11:00 | 119,000 | 1.16% |
| 46. | 11:15 | 103,795 | 1% |
| 47. | 11:30 | 108,124 | 1.4% |
| 48. | 11:45 | 102,077 | 0.99% |
| 49. | 12:00 | 104,941 | 1.1% |
| 50. | 12:15 | 103,949 | 1% |
| 51. | 12:30 | 111,129 | 1.8% |
| 52. | 12:45 | 104,424 | 1.1% |
| 53. | 13:00 | 109,079 | 1.6% |
| 54. | 13:15 | 119,320 | 1.16% |
| 55. | 13:30 | 109,382 | 1.6% |
| 56. | 13:45 | 102,797 | 0.100% |
| 57. | 14:00 | 104,726 | 1.1% |
| 58. | 14:15 | 115,179 | 1.11% |
| 59. | 14:30 | 106,494 | 1.3% |
| 60. | 14:45 | 110,192 | 1.7% |
| 61. | 15:00 | 106,086 | 1.2% |
| 62. | 15:15 | 109,710 | 1.7% |
| 63. | 15:30 | 113,174 | 1.10% |
| 64. | 15:45 | 109,943 | 1.7% |
| 65. | 16:00 | 108,719 | 1.6% |
| 66. | 16:15 | 108,554 | 1.6% |
| 67. | 16:30 | 107,139 | 1.3% |
| 68. | 16:45 | 109,969 | 1.7% |
| 69. | 17:00 | 110,703 | 1.8% |
| 70. | 17:15 | 106,773 | 1.3% |
| 71. | 17:30 | 111,877 | 1.9% |
| 72. | 17:45 | 126,511 | 1.22% |
| 73. | 18:00 | 110,587 | 1.7% |
| 74. | 18:15 | 115,432 | 1.11% |
| 75. | 18:30 | 110,019 | 1.7% |
| 76. | 18:45 | 111,084 | 1.8% |
| 77. | 19:00 | 111,380 | 1.8% |
| 78. | 19:15 | 113,983 | 1.10% |
| 79. | 19:30 | 112,796 | 1.10% |
| 80. | 19:45 | 117,513 | 1.13% |
| 81. | 20:00 | 108,969 | 1.6% |
| 82. | 20:15 | 112,941 | 1.10% |
| 83. | 20:30 | 115,981 | 1.12% |
| 84. | 20:45 | 111,287 | 1.8% |
| 85. | 21:00 | 113,346 | 1.10% |
| 86. | 21:15 | 109,833 | 1.7% |
| 87. | 21:30 | 109,774 | 1.7% |
| 88. | 21:45 | 108,466 | 1.4% |
| 89. | 22:00 | 108,724 | 1.6% |
| 90. | 22:15 | 106,535 | 1.3% |
| 91. | 22:30 | 106,650 | 1.3% |
| 92. | 22:45 | 107,436 | 1.3% |
| 93. | 23:00 | 107,450 | 1.3% |
| 94. | 23:15 | 107,093 | 1.3% |
| 95. | 23:30 | 109,246 | 1.6% |
| 96. | 23:45 | 123,498 | 1.20% |
This report was generated on March 23, 2026 02:17.
Report time frame September 11, 2016 00:18 to March 22, 2026 04:52.
| Web statistics report produced by: | |
 Analog 5.24 Analog 5.24 |  Report Magic for Analog 2.13 Report Magic for Analog 2.13 |