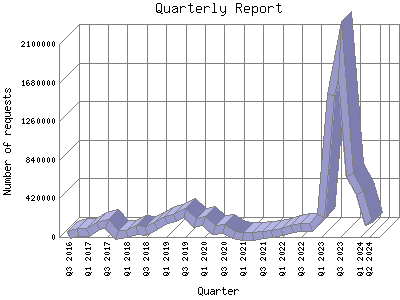
The Quarterly Report shows total activity on your site for each quarter of a
year. Remember that each page hit can result in several server requests as the
images for each page are loaded.
Note: Most likely, the first and
last quarters will not represent a complete quarter's worth of data, resulting
in lower hits.
| Quarter | Number of requests | Percentage of the requests | |
|---|---|---|---|
| 1. | Q1 2026 | 200,560 | 1.94% |
| 2. | Q4 2025 | 205,707 | 1.100% |
| 3. | Q3 2025 | 389,870 | 3.78% |
| 4. | Q2 2025 | 541,080 | 5.23% |
| 5. | Q1 2025 | 171,411 | 1.66% |
| 6. | Q4 2024 | 321,957 | 3.11% |
| 7. | Q3 2024 | 486,699 | 4.71% |
| 8. | Q2 2024 | 740,556 | 7.17% |
| 9. | Q1 2024 | 479,831 | 4.64% |
| 10. | Q4 2023 | 675,704 | 6.54% |
| 11. | Q3 2023 | 2,034,074 | 19.70% |
| 12. | Q2 2023 | 1,540,394 | 14.91% |
| 13. | Q1 2023 | 229,247 | 2.21% |
| 14. | Q4 2022 | 111,222 | 1.8% |
| 15. | Q3 2022 | 112,701 | 1.10% |
| 16. | Q2 2022 | 89,514 | 0.87% |
| 17. | Q1 2022 | 49,986 | 0.49% |
| 18. | Q4 2021 | 27,388 | 0.27% |
| 19. | Q3 2021 | 24,296 | 0.23% |
| 20. | Q2 2021 | 14,551 | 0.14% |
| 21. | Q1 2021 | 12,527 | 0.12% |
| 22. | Q4 2020 | 23,475 | 0.22% |
| 23. | Q3 2020 | 88,308 | 0.86% |
| 24. | Q2 2020 | 80,836 | 0.79% |
| 25. | Q1 2020 | 176,086 | 1.70% |
| 26. | Q4 2019 | 147,170 | 1.42% |
| 27. | Q3 2019 | 256,977 | 2.49% |
| 28. | Q2 2019 | 211,579 | 2.4% |
| 29. | Q1 2019 | 184,650 | 1.79% |
| 30. | Q4 2018 | 119,448 | 1.16% |
| 31. | Q3 2018 | 62,782 | 0.60% |
| 32. | Q2 2018 | 73,980 | 0.71% |
| 33. | Q1 2018 | 29,666 | 0.29% |
| 34. | Q4 2017 | 22,326 | 0.21% |
| 35. | Q3 2017 | 136,645 | 1.32% |
| 36. | Q2 2017 | 124,065 | 1.20% |
| 37. | Q1 2017 | 59,072 | 0.58% |
| 38. | Q4 2016 | 55,458 | 0.53% |
| 39. | Q3 2016 | 17,474 | 0.17% |
Most active quarter Q3 2023 : 2,034,074 requests handled.
Quarterly average: 264853 requests handled.
This report was generated on March 13, 2026 02:27.
Report time frame September 11, 2016 00:18 to March 12, 2026 04:45.
| Web statistics report produced by: | |
 Analog 5.24 Analog 5.24 |  Report Magic for Analog 2.13 Report Magic for Analog 2.13 |